The end of a comic era
Tonight I listened to the last episode of NPRs excellent and hilarious Ask Me Another, though originally broadcast on 2021-09-24, it didn’t reach my ears until tonight thanks to the magic of podcasts. It was genuinely hard to hear them sign off for the last time. I will really miss this show and the warmth and good spirits of Ophira Eisenberg and Jonathan Coulton.
I’ve been listening to this show since it started, back so far as to have been over syndicated FM broadcast on KQED at home and since on various digital media over the years wherever I’ve been, even here in Iraq. It suffered when Covid hit, the energy and charm didn’t translate well to zoom and without an audience as so many things didn’t and sadly didn’t live to see Covid restrictions lifted. It would have been fitting if they’d been able to record their last show at The Bell House one more time. Maybe someday they can have a reunion show.
US Public Radio has been an anchor of good quality programming, from Car Talk, which I still listen to weekly despite the questions being increasingly out of touch (though the cars have long been fairly irrelevant) and Fresh Air and Terry Gross‘ voice, which came from my mother’s kitchen radio every afternoon from WHYY about as far back as I can remember.

Technology: maximizing individual radius of lethality.
We like to look forward into the future by pattern matching against history, something human cognition does to reduce reality into space saving symbolic representation which leads us to see cyclic patterns in everything, even random noise. We also tend to allude to Luddites when talking about people with concern for the consequences of advances in technology, including AI, seeing a pattern of fear of novel technologies that so far hasn’t destroyed society and from this we take comfort that, so too, should the fears of AI become at some future time as laughable as fears of powered looms or telegraphs.
I am not so sanguine. While there are plenty of cycles to history: the seasons, feast and famine, periodic embrace and rejection of authoritarianism; there is also continuous trajectories that project into obvious limits: population growth limited by RuBisCO efficiency, the 38ZJ remaining of the 60ZJ battery capacity the carboniferous period so kindly charged up for us (also thanks to RuBisCO), the development of technology.
I find it convenient to think of technology as primarily a tool for amplifying an individual radius of lethality: while humans certainly enjoy non-lethal uses of technology, a primary driver has always been martial (whether marital is superior or subordinate to martial is a subtle question). Perhaps a tertiary fundamental purpose of technology is to reduce human inputs in consumable assets; the demand for such assets also likely having a limit. AI as we have it now has not existed before, this is novel, it is the current tip of the spear of a persistent and exponentially accelerating trend. There’s no known existence proof that technological advancement of a species is survivable.
We might consider a crude analogy (cognizant of the risks and seductive allure of reducing complex systems to symbols) that by considering technology an amplifier of lethality there are other elements of the implied circuit such as feedback which might considered an analogue of the tendency of actualized lethality to engender a lethal response; and irreducible noise which might be considered an analogue of the tendency of a response distribution to consistent inputs resulting in some distributive tail of human response to abnormally embrace lethality as a response to benign inputs. As technology advances, the gain of the system increases and while we might be familiar with an audio system feedback loop being, perhaps painfully, limited to amplifier clipping the only obvious limit to the maximum output of a technologically amplified lethality feedback loop is annihilation.
While AI as currently implemented shares no underlying mechanism by which we recognize sentience, it provides a fairly good illusion of it and it isn’t a given that there’s a meaningful distinction between the shadows of digital puppets and those of humans. We have a tendency to nostalgically cling to the assumption of some metaphysical value in what we hold to be true and legitimate or at least the output of labor intensive process, a distinction which comes and goes.
That AI might result in students escaping the mental rigors of learning recalls the (still ongoing) hand wringing over calculators, a fear which leans into the cyclic nature of history. On the other hand, human brains appear to be shrinking, likely as a consequence of intelligence being less selective in reproductive success, so the Luddites might have been right all along. Most of us do have a calculator with us at all times, despite what our grade school teachers might have said during arithmetic. While the progress of AI as a labor saving device reducing the energy consumption of our most extravagant organ might lead in time to meaningful changes in human capacity, it seems likely that devolution won’t get a chance to progress that far.
Sidebar featured images only on single post pages
After updating to WordPress 6.x and updating my theme (Clean Black based) and then merging the customizations back in with meld (yes, I really should do a child theme but this is a pretty simple theme so meld is fine), I didn’t really like the way the post thumbnails are shown, prefering to keep it to the right. I mean clean black was last updated in 2014 and while it still works fine, but that was a while ago. Plus I had hand-coded a theme sometime in the naughties and wanted to more or less keep it while taking advantage of some of the responsive features introduced about then.
Pretty much any question one might have, someone has asked it before, and I found some reasonable solutions, some more complex than others. There’s a reasonable 3 modification solution that works by creating another sidebar.php file (different name, same function) that gets called by single.php (and not the main page) that has the modification you want, but that seemed unnecessarily complicated. I settled on a conditional test is_singular which works to limit the get_the_post_thumbnail call to where I wanted and not to invoke it elsewhere. A few of the other options on the same stackexchange thread didn’t work for me, your install may be different. What I settled on (including a map call for geo-tagged posts) is:
<div id="sidebar">

      <?php if (is_singular('post') ) {
           echo get_the_post_thumbnail( $post->ID, 'thumbnail');
           echo GeoMashup::map('height=150&width=300&zoom=5&add_overview_control=false&add_map_type_control=false&add_map_control=false');
           } ?>

	<div class="widgetarea">

	<ul id="sidebarwidgeted">

<?php if (!dynamic_sidebar('Sidebar Top') ) : ?>

	<?php endif; ?>

	</ul>

	</div>

</div>
And I get what i was looking for, a graphical anchor at the top of the single post (but not pages) for the less purely lexically inclined that didn’t clutter the home page or other renderings with a wee bit o php.
LastPass: The Cloud is Public and Ephemeral
More or less, anytime I’m prompted, I’ll take the opportunity to say “The cloud, like its namesake, is public and ephemeral.” In his article, “A Breach at LastPass Has Password Lessons for Us All,” Brian X. Chen comes about as close as a mainstream press reports can without poking the apple-cart of corporate golden eggs over the wall in revealing how stupid it is for anyone to put any critical data on anyone else’s hardware.
The article covers a breach at LastPass, a password management service which invites users to store their password’s on LastPass’s computers somewhere in exchange for letting LastPass keep track of every website you visit that requires a password. For reasons that are a little hard to understand, rather a lot of people thought this was an acceptable idea and entrusted their passwords to what are likely important web services to some random company and their random employees that nobody using the service has ever met or ever will without any warranty or guarantee or legal recourse at all when the inevitable happens and there’s a data breach.
I suppose they believe that because the site appears to offer a service that looks like an analog of a safety deposit box, that there’d be some meaningful security guarantee just as users of gmail seem to assume that if you use gmail your email will be in some way “secure” and “private,” despite what the CEO of google tells you.
Obviously, LastPass was hacked and, obviously, every users’s secure account list (including their OnlyFans and Grindr accounts) and password database was exposed. This is guaranteed to happen eventually at every juicy target on the internet. It’s just probability: an internet service is exposed to everyone on the planet with a network connection (5,569,029,076 people as of today), and every target is attacked constantly (my own Fail2Ban has blocked 2,899,324 malicious packets) and even if they’re Google, they’re not smarter than the 5B+ people who can take a shot at them any time.
The most hilarious part of this is how idiotically fragile companies make themselves by chaining various “cloud services” into their service provision: LastPass was using a Cloud-Based Backup service that was hacked. People.. people.. that level of stupidity is unforgivable, but sadly not remotely criminal (though it should be). The risk of failure in a chained service increases exponentially with the length of the chain. Every dependency is a humiliation. This goes for developers too.
This breach means at least the attackers know every pr0n website millions of users have accounts on (as well as banks etc.) It isn’t clear how easily the passwords themselves will be exposed and LastPass’s technical description suggests a fairly robust encryption process which should be comforting if your master password is a completely randomly generated string of at least 12 characters you’ve managed to memorize, like n56PQZAeXSN6GBWB. If your password is some combination of dictionary words because you assumed, say, the master password was stored securely and you were only risking the password generator’s random passwords on sites (actually, not a bad strategy if you don’t then screw up security by using a commercial cloud-based password keeper that exposes your master password to global attack, but whatever), well if you did that check have i been pwned regularly for the next year and change every password you have.
The big lesson here is if you put your or your company’s data on someone else’s hardware, it isn’t your data any more it is theirs and you should assume that data is, or will soon be, public. So do not ever put critical data of any sort on anyone else’s hardware ever. It’s just stupid. Don’ t do it.
If you insist on doing so because, say, you’re not an IT person but you’d still like email or you’re a small company who can’t afford to hire an IT person, or who’s CIO has cut some side deals to “cut costs” by firing the IT staff and gifting the IT budget to his buddies running some crappy servers somewhere (and for some reason you haven’t fired that CIO yet), I’d suggest you have your lawyers carefully review recourse in the event of incompetence or malice. My personal starting point is to ask questions like the ones in this post and make sure the answers give comfort that the provider’s liability matches your risk.
What we need is a legal framework that makes every bit of user data a toxic asset. If a computer under your care has other people’s confidential data on it and that data is exposed to any parties not specifically and explicitly authorized by the person to whom the data is pertinent, you should be subject to a penalty sufficient to not just make a person who is harmed by the breach whole, but sufficient to dissuade anyone from ever taking a risk that could result in such an exposure again.
Companies who have business models that involve collecting and storing data about individuals should be required to hold liability insurance sufficient to cover all damages plus any punitive awards that might arise from mishandling or other liability. It is reasonable to expect that such obligations would make cloud services other than fully open/exposed ones with no personal data absurdly unprofitable and end them entirely; and this would be the optimal outcome.
Some gnuplot and datamash adventures
I’ve been collecting data on the state of the Ukrainian digital network since about the start of the war on a daily basis, some details of the process are in this post. I was creating and updating maps made with qgis when particularly notable things happened, generally correlated with significant damage to the Ukrainian power infrastructure (and/or data infrastructure). I wanted a way to provide a live update of the feed, and as all such projects go, the real reward was the friends made along the way to an automatically updated “live” summary stats table and graph.
My data collection tools generate some rather large CSV files for the mapping tools, but to keep a running summary, I also extract the daily total of responding servers and compute the day over day change and append those values to a running tally CSV file. A few really great tools from the Free Software Foundation help turn this simple data structure into a nicely formatted (I think) table and graph: datamash and gnuplot. I’m not remotely expert enough to get into the full details of these excellent tools, but I put together some tricks that are working for me and might help someone else trying to do something similar.
Using datamash for Statistical Summaries
Datamash is a great command line tool for getting statistics from text files like logs or CSV files or other relatively accessible and easily managed data sources. It is quite a bit easier to use and less resource intensive than R, or Gnu Octave, but obviously also much more limited. I really only wanted very basic statistics and wanted to be able to get to them from Bash with a cron job calling a simple script and for that sort of work, datamash is the tool of choice.
Basic statistics are easy to compute with datamash; but if you want a thousands grouped comma delimited median value of a data set that looks like 120,915 (say), you might need a slightly more complicated (but still one-liner) command like this:
Median="$(/usr/bin/datamash -t, median 2 < /trend.csv | datamash round 1 | sed ':a;s/\B[0-9]\{3\}\>/,&/;ta')"
Median= Assign the result to the variable $Median
-t, Comma delimited (instead of tab, default)
median one of a bazillion stats datamash can compute
2 use column two of the CSV data set.
< /trend.csv feed the previous command a CSV file nom nom
| datamash round 1 pipe the result back to datamash to round the decimals away
| sed (yadda yadda) pipe that result to sed to insert comma thousands separator*
Once I have these values properly formatted as readable strings, I needed a way to automatically insert those updates into a consistently formatted table like this:

I first create a dummy table with a plugin called TablePress with target dummy values (like +++Median) which I then extract as HTML and save as a template for later modification. With the help of a little external file inclusion code into WordPress, you can pull that formatted but now static HTML back into the post from a server-side file. Now all you need to do is modify the HTML file version of the table using sed via a cron job to replace the dummy values with the datamash computed values and then scp the table code with updated data to the server so it is rendered into the viewed page:
sed -i -e "s/+++Median/$Median/g" "stats_table.html"
/usr/bin/sshpass -P assphrase -f '~/.pass' /usr/bin/scp -r stats_table.html user@site.org:/usr/local/www/wp-content/uploads/stats_table.html
For this specific application the bash script runs daily via cron with appropriate datamash lines and table variable replacements to keep the table updated on a daily basis. It first copies the table template into a working directory, computes the latest values with datamash, then seds those updated values into the working copy of the table template, and scps that over the old version in the wp-content directory for visitor viewing pleasure.
Using gnuplot for Generating a Live Graph
The basic process of providing live data to the server is about the same. A different wordpress plugin, SVG Support, adds support for SVG filetypes within WordPress. I suspect this is not default since svg can contain active code, but a modern website without SVG support is like a fish without a bicycle, isn’t it? SVG is useful in this case in another way, the summary page integrates a scaled image which is linked to the full size SVG file. For bitmapped files, the scaled image (or thumbnail) is generated by downsampling the original (with ImageMagick, optimally, not GD) and that needs an active request (i.e. PHP code) to update. In this case, there’s no need since the SVG thumbnail is the just the original file resized—SVG: Scalable Vector Graphics FTW.
Gnuplot is a impressively full-featured graphing tool with a complex command structure. I had to piece together some details from various sources and then do some sedding to get the final touches as I wanted them. As every plot is different, I’ll just document the bits I pieced together myself, the plotting details go in the gnuplot command script, the other bits in a bash script executed later to add some non-standard formatting to the gnuplot svg output.
Title of the plot
The SVG <title> block is set as “Gnuplot” and I don’t see any way to change that from the command line, so I replaced it with the title I wanted, using a variable for the most recently updated data point extracted by datamash as above:
sed -i -e "s/<title>Gnuplot<\/title>/<title>Ukrainian Servers Responding on port 80 from 2022-03-05 to $LDate<\/title>/g" "/UKR-server-trend.svg" sed -i -e "s/<desc>Produced by GNUPLOT 5.2 patchlevel 2 <\/desc>/<desc>Daily automated update of Ukrainian server response statistics.<\/desc>/g" "/UKR-server-trend.svg"
This title value is used as the tab title. I’m not sure where the <desc> will show up, but likely read by various spiders and is an accessibility thing for online readers.
Last Data Point
I wanted the most recent server count to be visible at the end of the plot. This takes two steps: first plot that data point alone with a label (but no title so it doesn’t show up in the data key/legend) by adding a separate plot of just that last datum like:
"< tail -n 1 '/trend.csv'" u 1:2:2 w labels notitle
This works fine, but if you hover over the data point, it just pops up “gnuplot_plot_4” and I’d rather have more useful data so I sed that out and replace it with some values I got from datamash queries earlier in the script like so:
sed -i -e "s/<title>gnuplot_plot_4<\/title>/<title>Tot: $LTot; Diff: $LDif<\/title>/g" "/UKR-server-trend.svg"
Adding Link Text
SVG supports clickable links, but you can’t (I don’t think) define those URLs in the label command. So first set the visible text with a simple gnuplot label command:
set label "Black Rose Technology https://brt.llc" at graph 0.07,0.03 center tc rgb "#693738" font "copperplate,12"
and then enhance the resulting svg code with a link using good old sed:
sed -i -e "s#<text><tspan font-family=\"copperplate\" >Black Rose Technology https://brt.llc</tspan></text>#<a xlink:href=\"https://brt.llc/\" target=\"__blank\"><text><tspan font-family=\"copperplate\" >Black Rose Technology https://brt.llc</tspan></text></a>#g" "/UKR-server-trend.svg"
Hovertext for the Delta Bars
Adding hovertext to the ends of the daily delta bars was a bit more involved. The SVG <title> type is interpreted by most browsers as a hoverable element but adding visible data labels to the ends of the bars makes the graph icky noisy. Fortunately SVG supports transparent text. To get all this to work, I replot the entire bar graph data series as just labels like so:
'/trend.csv' using 1:3:3 with labels font "arial,4" notitle axes x1y2
But this leaves a very noisy looking graph, so we pull out our trusty sed to set opacity to “0” so they’re hidden:
sed -i -e "s/\(stroke=\"none\" fill=\"black\"\)\( font-family=\"arial\" font-size=\"4.00\"\)/\1 opacity=\"0\"\2/g" "/UKR-server-trend.svg"
and then find the data value and generate a <title> element of that data value using back-references. I must admit, I have not memorized regular expressions to the point where I can just write these and have them work on the first try: gnu’s sed tester is very helpful.
sed -i -e "s/\(<text><tspan font-family=\"arial\" >\)\([-1234567890]*\)<\/tspan><\/text>/\1\2<title>\2<\/title><\/tspan><\/text>/g" "/UKR-server-trend.svg"
And you get hovertext data interrogation. W00t!
Note that cron jobs are executed with different environment variables than user executed scripts, which can result in date formatting variations (which can be set explicitly in gnuplot) and thousands separator and decimal characters (,/.). To get consistent results with a cron job, explicitly set the appropriate locale, either in the script like
#!/bin/bash
LC_NUMERIC=en_US.UTF-8
...
or for all cron jobs as in crontab -e
LC_NUMERIC=en_US.UTF-8
MAILTO=user@domain.com
# .---------------- minute (0 - 59)
# |    .------------- hour (0 - 23)
# |    |      .---------- day of month (1 - 31)
# |    |      |    .------- month (1 - 12) OR jan,feb,mar,apr ...
# |    |      |    |    .---- day of week (0 - 6) (Sunday=0 or 7)  OR sun,mon,tue,wed,thu,fri,sat
# |    |      |    |    |
# *    *      *    *    *    <command to be executed>
The customized SVG file is SCPd to the server as before, replacing the previous day’s. Repeat visitors might have to clear their cache. It’s also important to disable caching on the site for the page, for example if using wp super cache or something, because there’s no signal to the cache management engine that the file has been updated.
Smol bash script for finding oversize media files
Sometimes you want to know if you have media files that are taking up more than their fair share of space. You compressed the file some time ago in an old, inefficient format, or you just need to archive the oversize stuff, this can help you find em. It’s different from file size detection in that it uses mediainfo to determine the media file length and a variety of other useful data bits and wc -c to get the size (so data rate includes any file overhead), and from that computes the total effective data rate. All math is done with bc, which is usually installed. Files are found recursively (descending into sub-directories) from the starting point (passed as first argument) using find.
basic usage would be:
./find-high-rate-media.sh /search/path/tostart/ [min bpp] [min data rate] [min size] > oversize.csv 2>&1
The script will then report media with a rate higher than minimum and size larger than minimum as a tab delimited list of filenames, calculated rate, and calculated size. Piping the output to a file, output.csv, makes it easy to sort and otherwise manipulate in LibreOffice Calc as a tab delimited file. The values are interpreted as the minimum for suppression of output, so any file that exceeds all three minimum triggers will be output to the screen (or .csv file if so redirected).
The script takes four command line variables:
- The starting directory, which defaults to . [defaults to the directory the script is executed in]
- The minimum bits per pixel (including audio, sorry) for exclusions (i.e. more bpp and the filename will be output) [defaults to 0.25 bpp]
- The minimum data rate in kbps [defaults to 1 kbps so files would by default only be excluded by bits per pixel rate]
- The minimum file size in megabytes [defaults to 1mb so files would by default only be excluded by bits per pixel rate]
Save the file as a name you like (such as find-high-rate-media.sh) and # chmod +x find-high-rate-media.sh and run it to find your oversized media.
!/usr/bin/bash
############################# USE #######################################################
# This creates a tab-delimeted CSV file of recursive directories of media files enumerating
# key compression parameters.  Note bits per pixel includes audio, somewhat necessarily given
# the simplicity of the analysis. This can throw off the calculation.
# find_media.sh /starting/path/ [min bits per pixel] [min data rate] [min file size mb]
# /find-high-rate-media.sh /Media 0.2 400 0 > /recomp.csv 2>&1
# The "find" command will traverse the file system from the starting path down.
# if output isn't directed to a CSV file, it will be written to screen. If directed to CSV
# this will generate a tab delimted csv file with key information about all found media files
# the extensions supported can be extended if it isn't complete, but verify that the
# format is parsable by the tools called for extracting media information - mostly mediainfo
# Typical bits per pixel range from 0.015 for a HVEC highly compressed file at the edge of obvious
# degradation to quite a bit higher.  Raw would be 24 or even 30 bits per pixel for 10bit raw.
# Uncompressed YUV video is about 12 bpp.
# this can be useful for finding under and/or overcompressed video files
# the program will suppress output if the files bits per pixel is below the supplied threshold
# to reverse this invert the rate test to " if (( $(bc  <<<"$rate < $maxr") )); then..."
# if a min data rate is supplied, output will be suppressed for files with a lower data rate
# if a min file size is supplied, output will be suppressed for files smaller than this size
########################################################################################

# No argument given?
if [ -z "$1" ]; then
  printf "\nUsage:\n  starting by default in the current directory and searchign recusrively \n"
  dir="$(pwd)"
  else
        dir="$1"
        echo -e "starting in " $dir ""
fi

if [ -z "$2" ]; then
  printf "\nUsage:\n  returning files with bits per pixel greater than default max of .25 bpp \n"
  maxr=0.25
  else
        maxr=$2
        echo -e "returning files with bits per pixel greater than " $maxr " bpp"
fi

if [ -z "$3" ]; then
  printf "\nUsage:\n  returning files with data rate greater than default max of 1 kbps \n"
  maxdr=1
  else
        maxdr=$3
        echo -e "returning files with data rate greater than " $maxdr " kbps"
fi


if [ -z "$4" ]; then
  printf "\nUsage:\n  no min file size provided returning files larger than 1MB \n"
  maxs=1
  else
        maxs=$4
        echo -e "returning files with file size greater than " $maxs " MB  \n\n"
fi


msec="1000"
kilo="1024"
reint='^[0-9]+$'
refp='^[0-9]+([.][0-9]+)?$'

echo -e "file path \t rate bpp \t rate kbps \t V CODEC \t A CODEC \t Frame Size \t FPS \t Runtime \t size MB"

find "$dir" -type f \( -iname \*.avi -o -iname \*.mkv -o -iname \*.mp4 -o -iname \*.wmv -iname \*.m4v \) -print0 | while read -rd $'\0' file
do
  if [[ -f "$file" ]]; then
    bps="0.1"
    size="$(wc -c  "$file" |  awk '{print $1}')"
    duration="$(mediainfo --Inform="Video;%Duration%" "$file")"
    if ! [[ $duration =~ $refp ]] ; then
       duration=$msec
    fi
    seconds=$(bc -l <<<"${duration}/${msec}")
    sizek=$(bc -l <<<"scale=1; ${size}/${kilo}")
    sizem=$(bc -l <<<"scale=1; ${sizek}/${kilo}")
    rate=$(bc -l <<<"scale=1; ${sizek}/${seconds}")
    codec="$(mediainfo --Inform="Video;%Format%" "$file")"
    audio="$(mediainfo --Inform="Audio;%Format%" "$file")"
    framerate="$(mediainfo --Inform="General;%FrameRate%" "$file")"
    if ! [[ $framerate =~ $refp ]] ; then
       framerate=100
    fi
    rtime="$(mediainfo --Inform="General;%Duration/String3%" "$file")"
    width="$(mediainfo --Inform="Video;%Width%" "$file")"
    if ! [[ $width =~ $reint ]] ; then
       width=1
    fi
    height="$(mediainfo --Inform="Video;%Height%" "$file")"
    if ! [[ $height =~ $reint ]] ; then
       height=1
    fi
    pixels=$(bc -l <<<"scale=1; ${width}*${height}*${seconds}*${framerate}")
    bps=$(bc -l <<<"scale=4; ${size}*8/${pixels}")
    if (( $(bc -l <<<"$bps > $maxr") )); then
        if (( $(bc -l <<<"$sizem > $maxs") )); then
            if (( $(bc -l <<<"$rate > $maxdr") )); then
                echo -e "$file" "\t" $bps "\t" $rate "\t" $codec "\t" $audio "\t" $width"x"$height "\t" $framerate "\t" $rtime "\t" $sizem
            fi
        fi
    fi
  fi
done
Results might look like:
Another common task is renaming video files with some key stats on the contents so they’re easier to find and compare. Linux has limited integration with media information (dolphin is somewhat capable, but thunar not so much). This little script also leans on mediainfo command line to append the following to the file name of media files recursively found below a starting directory path:
- WidthxHeight in pixels (e.g. 1920×1080)
- Runtime in HH-MM-SS.msec (e.g. 02-38-15.111) (colons aren’t a good thing in filenames, yah, it is confusingly like a date)
- CODEC name (e.g. AVC)
- Datarate (e.g. 1323kbps)
For example
kittyplay.mp4 -> kittyplay_1280x682_02-38-15.111_AVC_154.3kbps.mp4
The code is also available here.
#!/usr/bin/bash
PATH="/home/gessel/.local/bin:/usr/local/sbin:/usr/local/bin:/usr/sbin:/usr/bin:/sbin:/bin"

############################# USE #######################################################
# find_media.sh /starting/path/ (quote path names with spaces)
########################################################################################

# No argument given?
if [ -z "$1" ]; then
  printf "\nUsage:\n  pass a starting point like \"/Downloads/Media files/\" \n"
  exit 1
fi

msec="1000"
kilo="1024"
s="_"
x="x"
kbps="kbps"
dot="."

find "$1" -type f \( -iname \*.avi -o -iname \*.mkv -o -iname \*.mp4 -o -iname \*.wmv \) -print0 | while read -rd $'\0' file
do
  if [[ -f "$file" ]]; then
    size="$(wc -c  "$file" |  awk '{print $1}')"
    duration="$(mediainfo --Inform="Video;%Duration%" "$file")"
    seconds=$(bc -l <<<"${duration}/${msec}")
    sizek=$(bc -l <<<"scale=1; ${size}/${kilo}")
    sizem=$(bc -l <<<"scale=1; ${sizek}/${kilo}")
    rate=$(bc -l <<<"scale=1; ${sizek}/${seconds}")
    codec="$(mediainfo --Inform="Video;%Format%" "$file")"
    framerate="$(mediainfo --Inform="General;%FrameRate%" "$file")"
    rtime="$(mediainfo --Inform="General;%Duration/String3%" "$file")"
    runtime="${rtime//:/-}"
    width="$(mediainfo --Inform="Video;%Width%" "$file")"
    height="$(mediainfo --Inform="Video;%Height%" "$file")"
    fname="${file%.*}"
    ext="${file##*.}"
    $(mv "$file" "$fname$s$width$x$height$s$runtime$s$codec$s$rate$kbps$dot$ext")
  fi
done
If you don’t have mediainfo installed,
sudo apt update
sudo apt install mediainfo
Deep Learning Image Compression: nearly 10,000:1 compression ratio!
Here disclosed is a novel compression technique I call Deep Learning Semantic Vector Quantization (DLSVC) that achieves in this sample 9,039:1 compression! Compare this to JPEG at about 10:1 or even HEIC at about 20:1, and the absolutely incredible power of DL image compression becomes apparent.
Before I disclose the technique to achieve this absolutely stunning result, we need to understand a bit about the psychovisual mechanisms that are being exploited. A good starting point is thinking about:
It was a dark and stormy night and all through the house not a creature was stirring, not even a mouse.
I’m sure each person reading this develops an internal model, likely some combination of a snug, warm indoor Christmas scene while outside a storm raged, or something to that effect derived from the shared cultural semantic representation: a scene with a great deal of detail and complexity, despite the very short text string. The underlying mechanism is a sort of vector quantization where the text represents a series of vectors that semantically reference complex culturally shared elements that form a type of codebook.
If a person skilled at drawing were to attempt to represent this coded reference visually, it is likely the result would be recognizable to others as a representation of the text; that is, the text is an extremely compact symbolic representation of an image.
So now lets try a little AI assisted vector quantization of images. We can start with the a generic image from Wikipedia:
Next we use AI to reduce the image to a symbolic semantic representation. There are far more powerful AI systems available, but we’ll use one that allows normal people to play with it, @milhidaka’s caption generator on github:
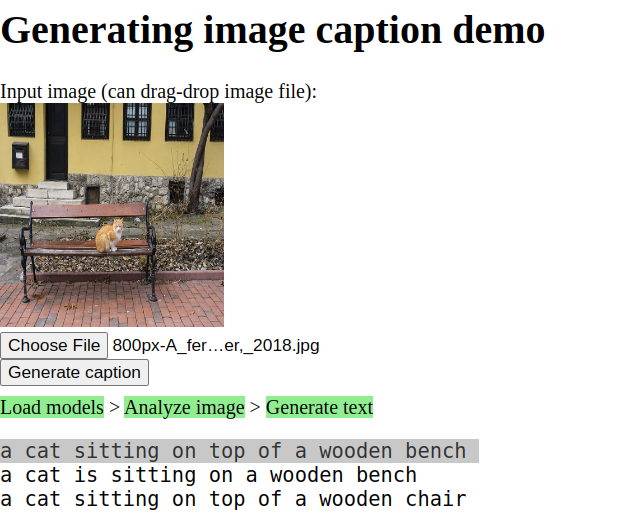
This is a cat sitting on top of a wooden bench which we can LZW compress assuming 26 character text to a mere 174 bits or 804D22134C834638D4CE3CE14058E38310D071087. That’s a pretty compact representation of an image! The model has been trained to understand a correlation between widely shared semantic symbols and elements of images and can reduce an image to a human-comprehensible, compact textual representation, effectively a lossy coding scheme referencing a massive shared codebook with complex grammatical rules that further increase the information density of the text.
Decoding those 174 bits back to the original text, we can feed them into an image generating generative AI model, like DALL·E mini and we get our original image back by reversing the process leveraging a different semantic model, but one also trained to the same human language.

It is clearly a lossy conversion, but here’s the thing: so too is human memory lossy. If you saw the original scene and 20 years later, someone said, “hey, remember that time we saw the cat sitting on a wooden bench in Varna, look, here’s a picture of it!” and showed you this picture, I mean aside from the funny looking cat like blob, you’d say “oh, yeah, cool, that was a cute cat.”
Using the DALL·E mini output as the basis for computing compression rather than the input image which could be arbitrarily large, we have 256×256×8×3 bits output = 1,572,864 bits to represent the output image raw.
WebP “low quality” compressing the 256×256 image yields a file of 146,080 bits or 10.77:1 compression.
My technique yields a compressed representation of 174 bits or 9,039:1 compression. DALL·E 2‘s 1024×1024 output size should yield 144,624:1 compression.
This is not a photograph. This is Dall-E 2’s 25,165,824 bit (raw) interpretation of the 174 bit text “a cat sitting on top of a wooden bench” which was derived by a different AI from the original image.
So just for comparison, lets consider how much we can compress the original image, resizing to 32×21 pixels and, say, webp, to 580 bytes.
 Even being generous and using the original file’s 7,111,400 bytes such that this blancmange of an image represents 12,261:1 compression, it is still 12× worse compression than our novel technique, it is hard to argue that this is a better representation of the original image than our AI-based semantic codebook compression achieved.
Pied Piper got nothin’ on this!
Audio Compression for Speech
Speech is generally a special class of audio files where compression quality is rated more on intelligibility than on fidelity, though the two related the former may be optimized at the expense of the latter to achieve very low data rates. A few codecs have emerged as particularly adept at this specific class: Speex, Opus, and the latest, Google’s Lyra, a deep learning enhanced codec.
Lyra is focused on Android and requires a bunch of Java cruft to build and needs debugging. It didn’t seem worth the effort, but I appreciate the Deep Learning based compression, it is clearly the most efficient compression possible.
I couldn’t find a quick whatcha-need-to-know is kind of summary of the codecs, so maybe this is useful:
Opus
On Ubuntu (and most Linux distros) you can install the Opus codec and supporting tools with a simple
# sudo apt install opus-tools
If you have ffmpeg installed, it provides a framework for dealing with IO and driving libopus from the command line like:
# ffmpeg -i infile.mp3 -codec:a libopus -b:a 8k -cutoff 8000 outfile.opus
Aside from infile.(format) and outfile.opus, there are two command line options that make sense to mess with to get good results: the bitrate -b:a (bit rate) and the -cutoff (frequency), which must be 4000 (narrowband), 6000 (mediumband), 8000 (wideband), 12000 (super wideband), or 20000 (fullband). The two parameters work together and for speech limiting bandwidth saves bits for speech.
There are various research papers on the significance of frequency components in speech intelligibility that range from about 4kHz to about 8kHz (and “sometimes higher”). I’d argue useful cutoffs are 6000 and 8000 for most applications. The fewer frequency components fed into the encoder, the more bps remain to encode the residual. There will be an optimum value which will maximize the subjective measure of intelligibility times the objective metric of average bit rate that has to be determined empirically for recording quality, speaker’s voice, and transmission requirements.
In my tests, my sample, the voice I had to work with an 8kHz bandwidth made little perceptible difference to the quality of speech. 6kbps VBR (-b:a 6k) compromised intelligibility, 8k did not, and 24k was not perceptibly compromised from the source.
one last option to consider might be the -application, which yields subtle differences in encoding results. The choices are voip which optimizes for speech, audio (default) which optimizes for fidelity, and lowdelay which minimizes latency for interactive applications.
# ffmpeg -i infile.mp3 -codec:a libopus -b:a 8k -application voip -cutoff 8000 outfile.opus
VLC player can play .opus files.
Speex
AFAIK, Speex isn’t callable by ffmpeg yet, but the speex installer has a tool speexenc that does the job.
# sudo apt install speex
Speexenc only eats raw and .wav files, the latter somewhat more easily managed. To convert an arbitrary input to wav, ffmpeg is your friend:
# ffmpeg -i infile.mp3 -f wav -bitexact -acodec pcm_s16le -ar 8000 -ac 1 wavfile.wav
Note the -ar 8000 option. This sets the sample rate to 8000 – Speexenc will yield unexpected output data rates unless sample rates are 8000, 16000, or 32000, and these should correlate to the speexenc bandwidth options that will be used in the compression step (speexenc doesn’t transcode to match): -n “narroband,” -w “wideband,” and -u “ultrawideband”
# speexenc -n --quality 3 --vbr --comp 10 wavfile.wav outfile.spx
This sets the bandwidth to “narrow” (matching the 8k input sample rate), the quality to 3 (see table for data rates), enables VBR (not enabled by default with speex, but it is with Opus), and the “complexity” to 10 (speex defaults to 3 for faster encode, Opus defaults to 10), thus giving a pretty head-to-head comparison with the default Opus settings.
VLC can also play speex .spx files. yay VLC.
Results
The result is an 8kbps stream which is to my ear more intelligible than Opus at 8kbps – not 😮 better, but 😐 better. This is atypical, I expected Opus to be obviously better and it wasn’t for this sample. I didn’t carefully evaluate the -application voip option, which would likely tip the tables results. Clearly YMMV so experiment.